Behind the Data

The Evolution of Irish Household Wealth Inequality Since 2013: Insights from new Distributional Wealth Accounts
Pierce Daly*
November 2022
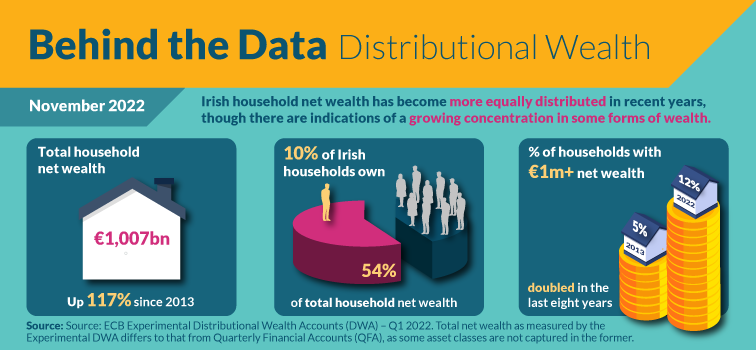
New Distributional Wealth Accounts (DWA) provide an innovative opportunity to observe the wealth distribution of households at a higher frequency. The quarterly dataset highlights that Irish household net wealth has increased significantly in recent years with net wealth inequality declining in the process. However, findings also point to a growing concentration of assets among wealthier households.

Household net wealth reached record highs in 2022, as evidenced in the latest Quarterly Financial Accounts (QFA). However, the QFA does not capture how this collective rise is distributed across households. This is important, as understanding the distribution of wealth is essential to assessing a wide range of questions, such as how economic shocks and subsequent policy responses may impact different households.
In the past decade there have been significant advances in the collection of granular data on the distribution of wealth, through surveys. Wealth surveys, such as the Household Finance and Consumption Survey (HFCS) in Europe, provide rich information on wealth holdings across individual households. Using the HFCS, Arrigoni, Boyd & McIndoe-Calder (2022) show that net wealth inequality in Ireland continued to fall between 2013 and 2020, driven by declining negative equity and differences in portfolio compositions across households.
However, wealth surveys also face limitations in the form of infrequency and data gaps. For example, the HFCS is only available for three points in time (2013, 2018 and 2020), while it under-represents the wealthiest 1% of households (CSO, 2022). Additionally, aggregate wealth implied by such surveys tends to be lower than corresponding values from national accounts sources like the QFA (Chakraborty et al., 2022). Thus, it may underestimate aggregate wealth and its inequality.
These limitations, together with the increased interest in wealth inequality since the financial crisis, has resulted in a growing demand for higher-frequency distributional data that is consistent with national accounts aggregates (see G20 recommendations to develop distributional national accounts, IMF & FSB, 2022). Consequently, distributional wealth accounts (DWA) have been developed for Canada and the United States (where they’ve also been used to examine the distributional impact of COVID-19 (Batty et al., 2021)).
New DWA are also being developed to fill this gap in the European system (Engel et al., 2022), with findings recently published for Germany (Bundesbank, 2022). This Behind the Data (BtD) presents the provisional DWA for Ireland. It examines the evolution in net wealth and its distribution, including the changing portfolio composition across households and key inequality indicators. While complementing existing Irish wealth papers, this BtD provides new insights and highlights the possibilities for further research in this area with these data. Given the provisional nature of these statistics, they may be subject to further refinement ahead of their planned release in 2023.
The data
In conjunction with the national central banks of 18 European countries, including Ireland, DWA are currently being developed as part of an initiative led by the European Central Bank (ECB).
The DWA combine distributional information from the HFCS with national accounts statistics (i.e. QFA and non-financial assets statistics) and information from rich lists. Thus, the final DWA simultaneously reflect distributional information from the HFCS, adjusted for the wealthiest households, the dynamics and levels of national accounts, on a quarterly frequency. Thereby enabling the more frequent and timely analysis of the wealth distribution in Ireland.
The resulting DWA statistics provide information on the distribution of both assets and liabilities, including net wealth. This information is split into 10 household groups (or ‘deciles’ – from poorest to richest), with data currently available for the period Q2 2013 to Q1 2022. The forthcoming incorporation of the 2020 HFCS (as well as revisions to the 2018 HFCS) may reduce overall inequality in future revisions of the DWA (as measured by indicators such as the Gini coefficient).
Net wealth has grown across the distribution
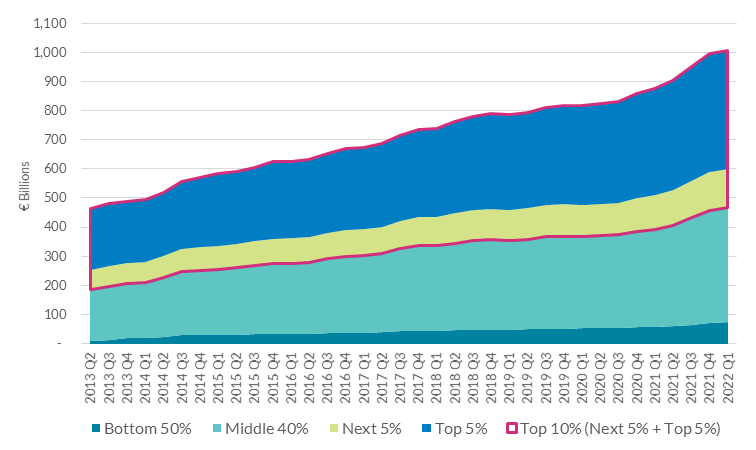
Consistent with the QFA, the DWA dataset highlights significant growth in the net wealth of Irish households in recent years. Between Q2 2013 and Q1 2022, Irish households’ collective net wealth grew by €544 billion, with net wealth increasing across the distribution (Chart 1)
Chart 1: Net Wealth Growth Across the Distribution

Source: DWA & Authors Calculations.
Notes: Wealth groupings are based on the net wealth distribution: the top 5% of the distribution (95% to 100%), the next 5% of the distribution (90% - 95%), the following middle 40% (50% to 90%) and the bottom 50% of the distribution (0% to 50%).
The Top 10% of households accounted for 48% of this growth, most of which related to the Top 5%. By contrast, the Bottom 50% accounted for only 12% of this collective rise, while the remainder of the increase related to the Middle 40%.
Approximately 80% of the increase in the net wealth for the Middle 40% over this period can be attributed to increases in housing wealth (Chart 2), with the remainder a combination of growth in business wealth, deposits and other financial assets. Housing wealth also represents a significant share (64%) of the increase for the Top 10%, though growing business wealth and financial assets are also important.
Chart 2: Wealth Structure & Change Along the Net Wealth Distribution

Source: DWA & Authors Calculations.
Notes: Other Financial Assets include debt securities, listed shares, investment fund shares, and life insurance and annuity entitlements, they do not include pension entitlements or currency given low comparability between the HFCS and QFA. Business wealth includes financial business wealth (unlisted shares and other equity) and non-financial business wealth (e.g. business property and land)
By contrast, growth in the net wealth of the Bottom 50% between 2013 and 2022 mainly reflects the large reduction in mortgage debt for this household group, with only a small share of the increase coming from assets (mainly housing and deposits).
This deleveraging, coupled in particular with the growth in financial assets among certain household groups, illustrates the improved resilience of Irish households in the past decade. This is important given the present macro-economic environment, whereby inflation is putting pressure on household finances (see latest Quarterly Bulletin).
Declining inequality of net wealth across deciles
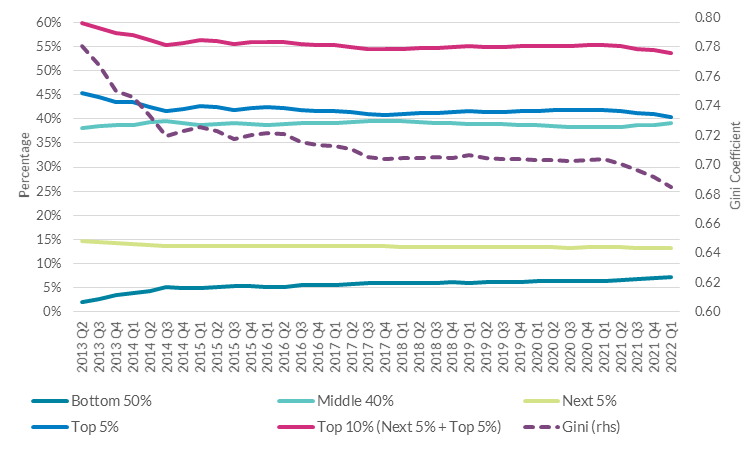
While the Top 10% of households accounted for almost half of growth in net wealth in monetary terms, the deciles share of net wealth actually declined between 2013 and 2022, from 60% to 54% (Chart 3). This is due to the stronger rate of growth in the net wealth of the Bottom 50%, with the share of net wealth attributed to this cohort increasing from 2% to 7% over the same time period.
As a result, the deleveraging of the Bottom 50% plays a key role in the decline in the overall inequality of net wealth in Ireland. This is illustrated through the downward trend in the Gini coefficient, a common indicator used to measure the degree of inequality of income or wealth among households (Chart 3).
Chart 3: Net Wealth Shares & the Gini Coefficient for Ireland

Source: European Central Bank, Distributional Wealth Accounts
Notes: A Gini coefficient of ‘0’ implies perfect equality (i.e. where all households have the same level of wealth), while a Gini coefficient of ‘1’ expresses maximum inequality (i.e. where one household holds all the wealth).
The Gini coefficient fell from 0.78 in Q2 2013 to 0.70 as of Q4 2020, before declining sharply since 2021 (Chart 3). This steeper decline in 2021 is driven by increasing net wealth for the Bottom 50%, accounted for by a combination of a decline in this groups mortgage liabilities and, to a lesser extent, an upward appreciation in the value of housing assets. As a consequence, by Q1 2022 the Gini coefficient for Ireland stood at 0.68.
Indications of growing concentration amongst wealthier households
Net wealth shares and the Gini coefficient provide beneficial and standard measures of the aggregate movements in net wealth inequality. However, the DWA also provides opportunities for more in-depth analysis of the wealth distribution at an instrument level, as well as through a variety of other inequality indicators.
For example, one such indicator, the share of households with net wealth of €1 million or more, suggests that the share of households that are millionaires has more than doubled from 5% to 12% between Q2 2013 and Q1 2022, increasing from approximately 87,000 to 223,000 households over this period.
This in part reflects the overall gains in household net wealth across the distribution since 2013, as shown in Chart 1. However, it may also reflect a growing concentration of certain forms of wealth. For example, Chart 2 demonstrates that the Middle 40% and Top 10% of households account for almost all growth in assets (particularly housing and business wealth) since 2013, whereas the net wealth increase for the Bottom 50% mainly reflects the deleveraging of this group.
Overall, this declining indebtedness of the Bottom 50% plays a central role in falling net wealth inequality, however, one must be mindful of indications that some assets may have become increasingly concentrated among wealthier households in recent years, warranting further investigation.
Conclusion
This BtD presents new quarterly distributional wealth statistics for Ireland, developed in tandem with the ECB and other European countries. In particular, findings demonstrate the richness of the DWA and its potential to complement existing micro data sources such as the HFCS in understanding a myriad of economic questions. Moreover, it provides the first insights into the DWAs potential for examining evolutions in the distribution of household wealth and at a higher frequency.
Despite large increases in net wealth across household groups in recent years, this has been associated with a decline in aggregate net wealth inequality. This is illustrated in the decline in the Gini coefficient for Ireland as well as the falling share of net wealth attributed to the Top 10% and corresponding increase for the Bottom 50%.
However, there is also some evidence of a growing concentration of assets among some wealthier cohorts. For example, the doubling of the number of millionaire households and concentration of growth in assets (particularly housing and business wealth) among the Middle 40% and Top 10% groups, suggests that some assets may have become increasingly concentrated among wealthier households since 2013.
In combination these findings suggest that while there has been an overall decline in net wealth depicted by indicators such as the Gini, further analysis is required on the concentration of ownership at an instrument level, to analyse the distribution of individual asset and liability types and how they drive trends in the overall net wealth distribution.
Finally, given the provisional nature of the DWA, the estimations and assumptions used in its compilation may be further refined in order to maximise the accuracy of the dataset and its comparability to the QFA.
*Email [email protected] and [email protected] if you have any comments or questions on this note. Comments from Jenny Osbourne Kinch, Rory McElligott, Maria Woods, Anne-Marie Kilkenny, Tara McIndoe-Calder, Laura Boyd and Fergal McCann are gratefully acknowledged. The views expressed in this note are those of the authors and do not necessarily reflect the views of the Central Bank of Ireland or the ESCB.
See also: