Quarterly Financial Accounts
The Quarterly Financial Accounts (QFA) present a complete and consistent set of quarterly financial data for all sectors of the Irish economy. They provide comprehensive information on the financial and investment activities of households, non-financial corporations, financial corporations, government and the rest of the world. The whom-to-whom tables provide information on the interactions between these sectors.
Key Points – Q3 2025
Publication date: 22 January 2026
-
The Irish economy remained a net lender in Q3 2025, with a net lending position of €7.3bn.
- Financial corporations were net borrowers in the quarter, mainly due to the large borrowing position of investment funds (-€14.3bn).
- Total liabilities of non-financial corporations increased by €20.6bn, to stand at €2,876bn over the quarter.
- The net financial wealth of households increased by €17.2bn during the quarter. This was mainly due to positive revaluations and other changes of €11.2bn.
- Government liabilities stood at €240.4bn and assets at €149.1bn as of Q3 2025. This resulted in a net financial wealth position of -€91.3bn.
In addition to the latest Q3 2025 data, this release incorporates revisions for reference periods Q1 2013 to Q2 2025.
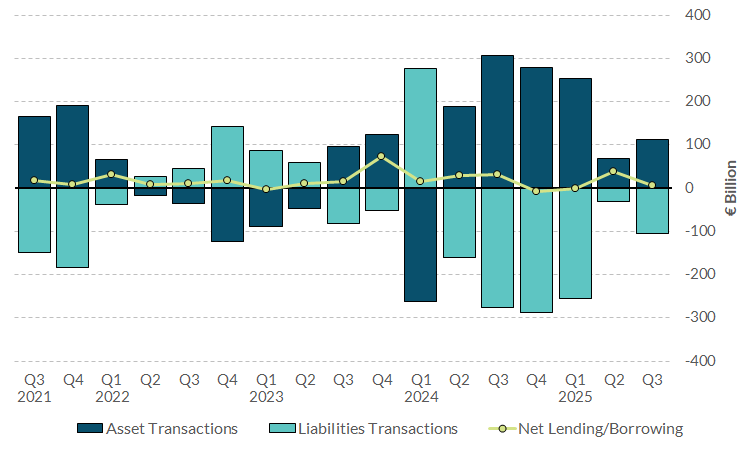
Chart 1: Net Financial Transactions of the Overall Irish Economy

View data for chart 1 | xlsx 21 KB
Overall, the Irish economy remained a net lender in the period, as net investment in financial assets exceeded the net incurrence of financial liabilities by €7.3bn.
Financial investment in the quarter occurred across the instruments, debt securities (€84.2bn), equity (€71.1bn), and deposits (€23.9bn). These transactions, together with total asset revaluations of €213.4bn, led the total stock of financial assets of the domestic economy to reach €12,826bn at the end of Q3 2025. This is up from €12,478bn at the end of Q2 2025.
Transactions in liabilities were primarily related to investment fund shares (€137.8bn). Total liabilities stood at €13,166bn, up €321.1bn when compared to the previous quarter.
The difference between total financial assets and liabilities of the Irish economy results in a net financial wealth position of -€339.5bn, reducing by €27.0bn since the previous quarter.
Financial corporations accounted for approximately 78 per cent of total financial assets in Ireland, with investment funds alone representing 39 per cent of the total.
Chart 2: Borrowing and Lending across Sectors of the Irish Economy

View data for chart 2 | xlsx 16 KB
Households reported the largest net lending position of any sector, marginally above non-financial corporations (NFCs). Households’ acquisition of assets surpassed their incurrence of liabilities in the quarter by €5.9bn.
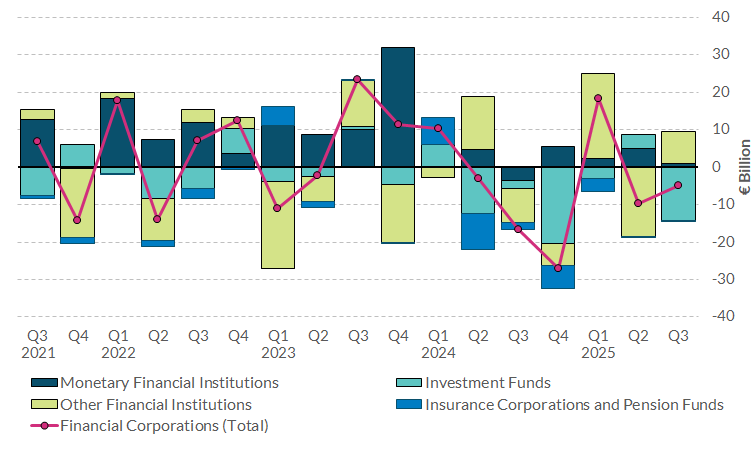
Financial corporations were net lenders vis-à-vis the rest of the world, but net borrowers with NFCs, households and the government. This resulted in an overall net borrowing position for the sector, totalling -€4.8bn.
Chart 3: Net Transactions of Irish Financial Corporations

View data for chart 3 | xlsx 21 KB
Monetary financial institutions and other financial institutions were both net lenders in Q3 2025 at €0.8bn and €8.7bn, respectively.
Investment funds were net borrowers in Q3 2025 (by -€14.3bn). Investment funds reported positive investment in listed shares and debt securities, while borrowing was driven by large issuances of non-MMF investment fund shares/units (€106.8bn).
Insurance corporations and pension funds were only marginally net borrowers (-€0.1bn), with both sectors reporting generally moderate movements in the quarter.
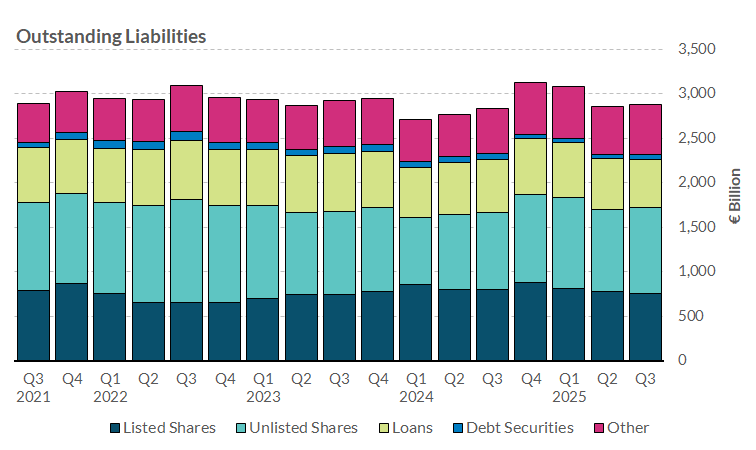
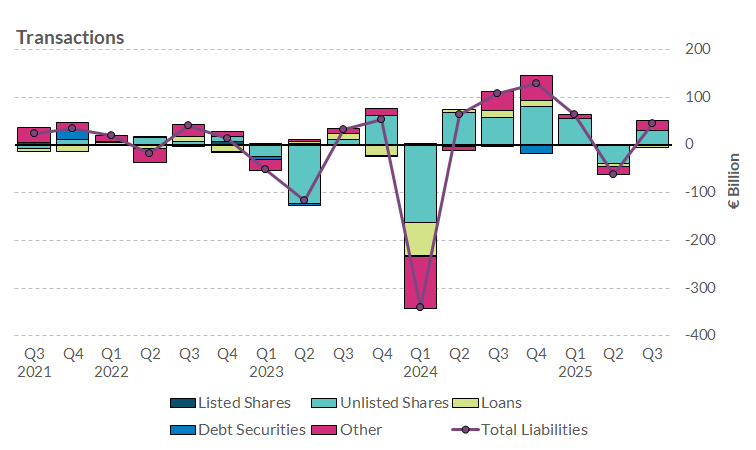
Chart 4: Funding of Irish NFC's and their Liabilities Transactions


View data for chart 4 | xlsx 18 KB
Total liabilities of Irish NFCs increased by €20.6bn to stand at €2,876bn, up from €2,855bn at end Q2 2025. This was primarily driven by increases in unlisted shares (€43.7bn), debt securities (€9.6bn) and other liabilities including trade credits (€19.7bn), offset by decreases in loans (-€29.7bn) and listed shares (-€22.6bn).
Equity remained the main source of funding for NFCs, with listed and unlisted shares amounting to around 60 per cent of the sector’s total liabilities.
NFCs’ debt (loans and debt securities liabilities) stood at €597.3bn in Q3 2025, decreasing from €617.5bn at the end of the previous quarter.
Chart 5: Change in Households' Financial Net Wealth

View data for chart 5 | xlsx 19 KB
The financial net wealth of Irish households increased by €17.2bn in the quarter, to reach €431.9bn. Revaluations and other changes contributed €11.2bn to this movement, while investment in financial assets totalled €6.6bn.
Households’ total financial assets stood at €589.0bn, an increase of €18.3bn from the end of the previous quarter. This was mainly driven by insurance and pension standardised guarantee schemes (€12.0bn) and an increase in deposits (€2.5bn).
Total households’ liabilities stood at €157.1bn at the end of Q3 2025, having increased by €1.1bn over the quarter. Long-term loans accounted for 95 per cent of overall household liabilities in Ireland.
Chart 6: Government Debt and Composition
 View data for chart 6 | xlsx 22 KB
Irish government debt (comprising loans, short-term and long-term debt securities) increased by €2.9bn in Q3 2025, to stand at €196.1bn.
Transactions in government financial assets totalled €4.1bn over the quarter. This was mainly driven by deposits (€1.7bn) and debt securities (€1.7bn).
The acquisition of liabilities in the period equalled €3.8bn, with the main movement being an increase of €2.7bn in debt securities, split between short-term (€1.1bn) and long-term (€1.5bn) maturity.
Government financial assets stood at €149.1bn as of Q3 2025, while liabilities totalled €240.4bn. This resulted in a net financial wealth position of -€91.3bn at the end of the quarter, continuing the government’s recent trend of improving net financial position.
Data
Quarterly Financial Accounts for Ireland Q3 2025 | pdf 486 KB
Financial Accounts for Ireland | xls 6555 KB
Whom-to-whom Tables | xls 10459 KB
Publication Notes | pdf 238 KB
Glossary | pdf 426 KB