Behind the Data – Insights from Irish Payment Fraud Statistics

Sangamithra Varadarajan*
January 2025
New data on payment fraud reveals that Irish fraud rates are below the EU averages except for card payments. The types of fraud vary depending on the payment methods used and most fraudulent payments are sent to fraudsters’ accounts located outside Ireland.
Fraudulent payments have become a growing concern in Europe, especially in the rapidly evolving digital marketplace. The joint European Banking Authority and European Central Bank publication on EEA wide Payment fraudassessed a total value of €4.3 billion in fraudulent payments in the year 2022 and €2.0 billion in the first half of 2023.
Fraudsters continually adopt new ways to exploit digital systems and bypass security measures, costing businesses and individuals millions of euros every year. Common methods include phishing, where fake emails or text messages trick people into revealing personal information, psychological manipulation of the payer to send money via social networks or impersonating as a trusted party, making unauthorised payments using lost or stolen cards.
This Behind the Data presents new insights on payments fraud in Ireland by main payment methods such as credit transfers, card payments, e-money and direct debits.1 It examines how fraud varies across payment methods, which types of frauds are most common and how much money is lost due to fraud.
The Data
Payments fraud data is reported by payment service providers (PSPs) including banks, credit unions, payment institutions and e-money institutions and payment service operators (companies that processes clearing and settlement of payment transactions) resident in Ireland in accordance with the Payment Statistics Regulation introduced in 2022.
This data is collected on a semi-annual basis, and includes:
- Total value and volume of fraudulent payment transactions by payment methods used (card payments, cash withdrawals, credit transfers, direct debits, electronic-money and remittances).
- Fraud type.
- Losses due to fraud and the distribution of losses among payment service user, payment service provider and other parties.
- Granular details include regional breakdown by country, payment channel used whether electronic or non-electronic (file or paper based forms), payment sub channel used whether online (remote) or via payment terminal at the counter (non-remote), use of strong customer authentication (SCA) in payment.
Fraudulent payments on the rise but fraud rates remains low
The rate of fraud in Ireland as a share of all transactions is low. By value, the rate is 0.001%, and by volume, the rate is 0.01%. For the volume rate, this is equivalent to 1 in 10,000 payment transactions impacted by fraud.
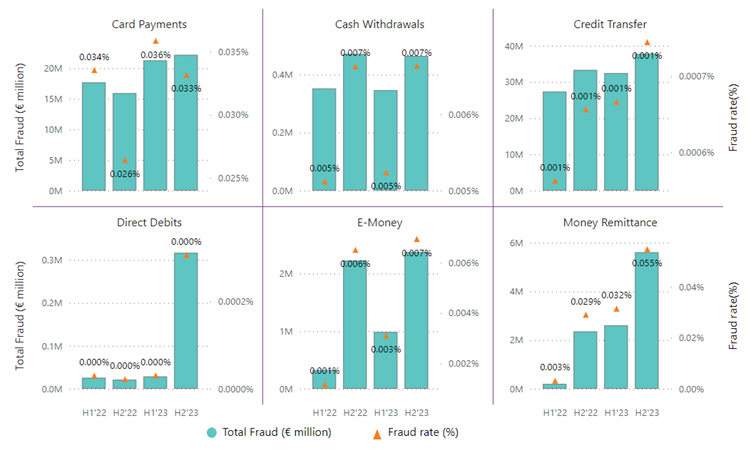
Fraud rates remain low when calculated by payment institution group or payment method, although there is variation between categories. Payment and e-money institutions initially registered higher fraud rates in 2022, 0.015% and 0.005% respectively, in terms of value. However, they declined to 0.004% and 0.003% in H2-2023, which brought them more in line with the 0.001% fraud rate for banks and credit unions. Amongst payment methods, the fraud rate of card payments is by far the highest, with 0.034% being fraudulent (Chart 2).
The total value of fraudulent payments rose by 26% in 2023, increasing to €126 million from €100 million in 2022. Credit transfers and card payments accounted for the majority of all fraud.
As per the published data on payment statistics, credit transfers are the largest in terms of value and often used for large value payments compared with other payment methods in Ireland. This also applies to fraudulent payments. Approximately 60% of the value of fraud, amounting to €70 million in 2023, was made through credit transfer. Although, credit transfers only accounted for 4% of the total number of fraudulent transactions, equalling to 24k payments. (Chart 1)
The total number of fraudulent transactions grew at a faster pace, rising by 43% to 568k in 2023 from the previous year's figure of 396K. Card payments accounted for 70% of the volume of payment fraud, amounting to 397k transactions in 2023 and 318K in 2022.
It is worth noting that the euro value of fraudulent payment increased by a smaller amount compared to volume of fraud in 2023, indicating a preference by the fraudsters for numerous low value payments made using cards.
Chart 1: Total value and volume of fraudulent payments by Payment methods and Fraud rate (fraud as a share of total value of payments) in %

Money remittances saw a noticeable rise in fraud in 2023. The value of these frauds has more than tripled, increasing from €2.5 million in 2022 to €8.2 million in 2023. Money remittances describe a scenario where the payer or payee does not require a payment account with the PSP and usually involves cash at one or either end of the transaction. This includes typical remittances (i.e. sending money back to family in another country), but also some refunds of consumer goods.
Chart 2: Total value (€ millions) of fraudulent payments by payment methods; fraud rate (%) (fraud as a share of total value of transactions)
Irish payments fraud in an EU context
Ireland has a lower reported fraud rate than the EU across most payment methods. In particular, it is lower for credit transfers, e-money and direct debits. In contrast, card payments saw a slightly higher fraud rate in Ireland in the first half of 2022 and 2023, 0.034% and 0.036% respectively, as compared to EU level figures of 0.026% and 0.031%.
Chart 3: Payment fraud rate in Ireland vs European level by payment methods (in values)

Geographic dimensions of Fraud broadly aligns with the European Union
The accounts to which the fraudulent payments were sent are mostly located outside of Ireland. Approximately 60% of the total value of fraud across 2022-2023 involved cross-border payments, amounting to € 77 million in 2023 and € 64 million in 2022. Fraudulent payments sent to domestic accounts amounted to € 49 million in 2023 and € 36 million in 2022. The primacy of cross-border payments in fraudulent transactions is stronger in volume terms, accounting for 75% of total fraud (309k and 433k transactions in 2022 and 2023).
Fraud disproportionately relates to cross-border payments, reflecting similar trends as the EU. The majority of card payment fraud involved cross-border payments (35% within EU and 41% outside of EU by value in 2023), despite nearly half of total card payments being domestic. Similarly for direct debits, 99% of the fraud in 2023 involved cross-border payments, whereas 94% of the total direct debits were domestic (Chart 4).
Chart 4: Shares of Fraudulent payments sent (in values) vs total payments (in values) by region and payment methods
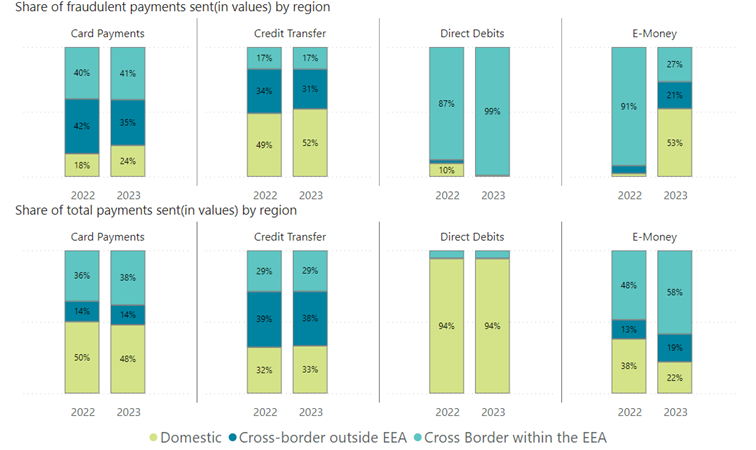
In the EU, the majority of credit transfers (around 80% in value) and e-money payments (around 75% in value) were domestic, with fraudulent payments predominantly relating to cross-border transactions. However, in Ireland total credit transfers and e-money payments were concentrated in cross-border payments, while fraudulent payments were more spread out across all regions during 2022-2023.
Fraud types vary by payment methods used
Payment Frauds are broadly classified into four types under the payments regulation and the breakdown is collected for all electronically initiated payment types.
Around 98% of card payment fraud by value was accounted for by ‘issuance of payment orders by the fraudster’. This occurs where fraudsters use stolen card, account or personal information for a payment.
Chart 5: Share of main fraud types (by value), by payment methods
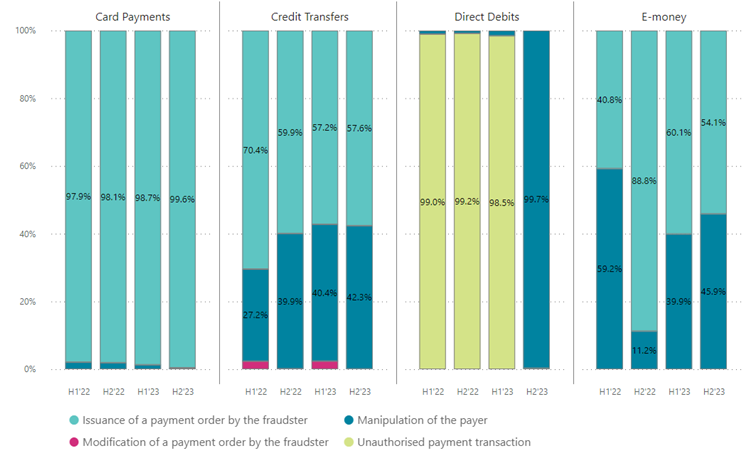
‘Manipulation of the Payer fraud’ occurs where a fraudster gains trust by social engineering or impersonation and convinces the payer to make payments to them. This is evident in credit transfers and e-money payment. In fraudulent credit transfers, payer manipulation fraud rose from 27% in the first half of 2022 to 42% by the end of 2023.
‘Unauthorised payment transactions’ is more specific to direct debits where a fraudster obtains customer information and sets up mandates without the authorisation of the payer. Over 99% of all fraudulent direct debits related to such fraud with an exception in the second half of 2023 due to a once off incident recorded in this category.
‘Modification of Payment order by fraudster’ occurs when a fraudster intercepts and modifies a legitimate payment order. It is rare (less than 2 % of all fraud by value) and observed only in credit transfers.
Increased risk on Non-Strong Customer Authentication transactions as fraudsters target on low value payments
Strong Customer Authentication (SCA) is a requirement set by the European Union to reduce fraud in electronic payments. It requires two-factor authentication to verify a customer’s identity while making payments. For example, a customer may be asked to verify a payment by entering their pin number via their bank app. SCA can be exempted based on the level of risk, payment amount, if a payment is recurring and the payment channel used for the execution of the payment transaction.
Chart 6: Fraud rate and total value of fraudulent payments by SCA vs non-SCA and payment methods
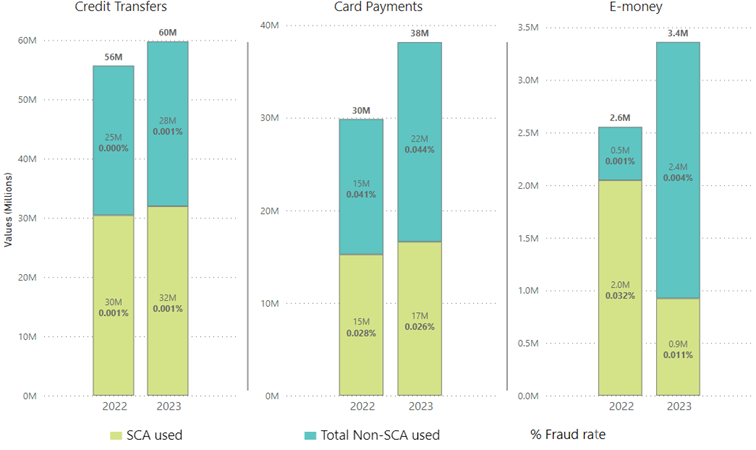
Around 50% of fraudulent payments by value were not authenticated via SCA, amounting to €52 million in 2023 (all three payment methods combined). Card payments not authenticated using SCA were subject to a higher fraud rate of 0.04% in 2023. The application of SCA did not materially change the fraud rate for credit transfers, which remained low and steady at 0.001%. Contrary to expectations, e-money payments saw higher fraud rates where SCA was used (Chart 6).
Looking into the reasons for not applying SCA on fraudulent payments, ‘others’ was the primary reason provided for card payments (Chart 7). One such scenario could be cross-border payments sent to fraudsters’ accounts outside EEA where the application of SCA is not legally required. This underscores the cross-border nature of payment fraud and the challenges in securing cross-border transactions sent outside of EEA.
Chart 7: Fraudulent payments (in values) without SCA by reason for not applying SCA
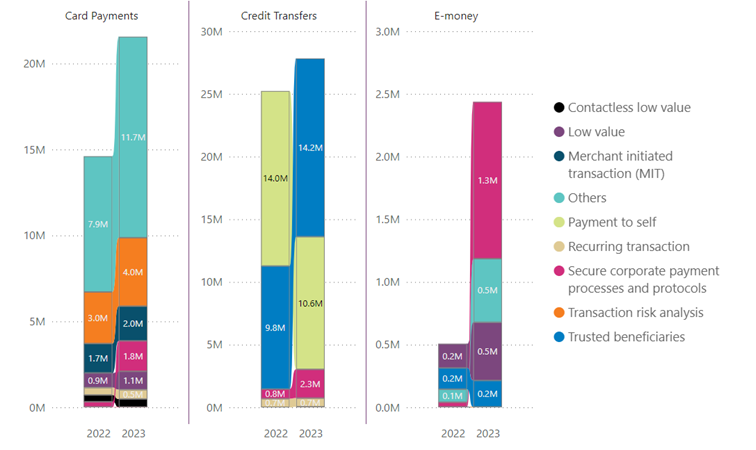
“Payment to self” and “trusted beneficiaries” are the most used exemptions for fraudulent credit transfers, and “low value exemption” is widely used in fraudulent E-money payments.2 3 4
Online payments dominates card payment fraud
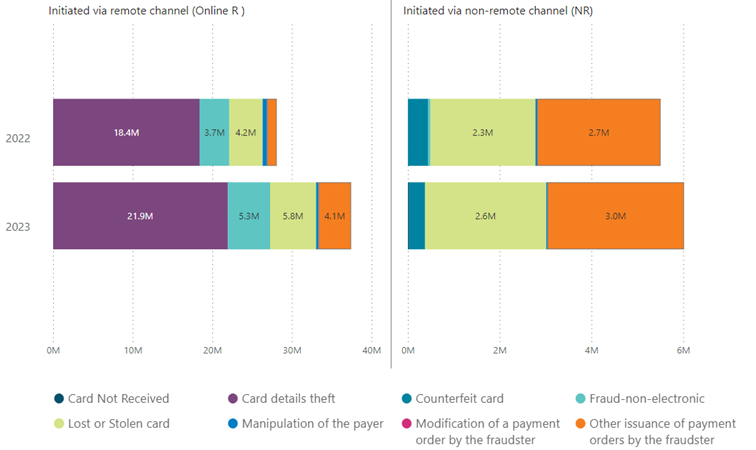
Online card payments made up 86% of the total value of card fraud in 2023, amounting to €37.4 million. Card payments fraud primarily stems from the issuance of a payment order by fraudsters accounting for over 99% of the value of fraud (Chart 5). This category includes card detail theft, card not received, counterfeit card, lost or stolen card and others.
Card detail theft is the most common amongst these explanations, accounting for two thirds of online card fraud (Chart 8). An example of this would be a fraudster making a fraudulent payment using stolen card details obtained by cloning or stealing card information by installing a small device on ATMs or by hacking a public Wi-Fi.
Fraud in non-remote payments are approximately equally split in ‘Lost or stolen card’ (44% in values) and an ‘Other’ category (49% in values). The “Other” category contains any fraud where the fraudster gains card details by any other means not explicitly listed in the Chart 8.
Chart 8: Value of Fraudulent Card Payments by fraud types and initiation channel used
Online card payments have shown a fraud rate of 0.06% by value, six times higher than the 0.01% rate for non-remote payments (made using physical payment terminals) in 2023. Paying online via mobile communication technology such as digital wallets and payment apps face an even higher fraud rate of 0.07%. Contactless payments or ‘tap and go’ using mobile phones, wearable devices or physical cards shown a lower fraud rate of 0.02%, making them safer than online payments.
A large share of online card payments did not use SCA. This accounted for 76% of the total number of online card payments in 2023 and 74% in 2022. Consequently, around 80% of online card fraud in volume terms was SCA-exempted.
Payment service users were most impacted by fraud Liability Losses during 2022 and 2023
Reported losses due to payment fraud amounted to €40.8 and €59.6 million in 2022 and 2023. These figures cover the cost of fraud across payment instruments, including credit transfers, direct debits, card payments, cash withdrawals and e-money payments.
A breakdown of costs borne by the reporting payment service provider (PSP), payment service user of the reporting PSP and other parties are shown below (Chart 9).
Chart 9: Losses due to fraud by liability bearers
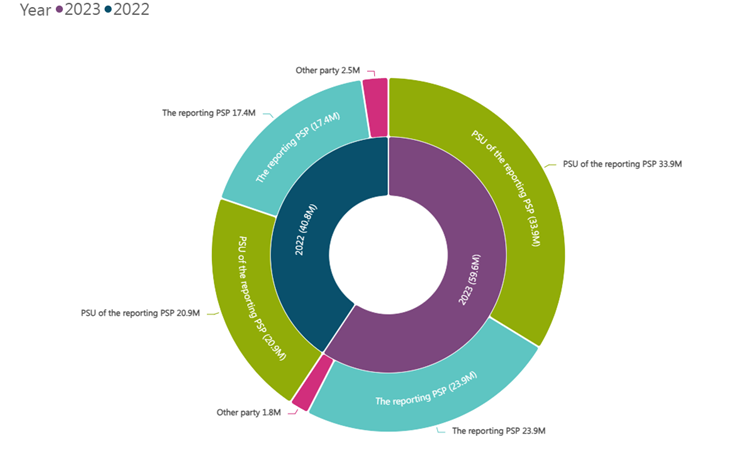
Total losses for payment service users were €20.9 and €33.9 million in 2022 and 2023 respectively. This was 51% and 57 % of the total value of reported losses due to fraud by the liability bearer. Credit transfers and card payments both within the Irish resident and broader European data exhibited the highest fraud losses.
While higher levels were reported in 2023 when compared to 2022, the monitoring of these trends will assist in informing policy decisions and encourage industry to put in place further actions to reduce these costs to both themselves and their customers.
Conclusion
This behind the data has presented an initial insight into payment fraud statistics. The payment fraud rate in Ireland is low and below the EU average except for card payments. It is evident that fraud types vary based on the payment methods used. Fraud is mainly cross-border and is more present when SCA is not applied.
Active campaigns by industry bodies such as Fraudsmart and Central Bank campaigns such as consumer scam advice can help to make consumers more alert to fraudsters.
Further expansion of published data will be forthcoming in 2025, both at a national level and European level. The Central Bank plans to provide semi-annual updates on payment fraud statistics, including linking these to the wider European data publications. This will allow for more transparency in this space and allow trends to be monitored.
*Email [email protected] if you have any comments or questions on this note. Comments from Barra McCarthy, David Duignan, and Jean Cassidy are gratefully acknowledged. Thank you to Siobhan O'Connell for her contribution to earlier draft and guidance. The views expressed in this note are those of the authors and do not necessarily reflect the views of the Central Bank of Ireland or the ESCB.
[1] Payment to self-exemption applies where the payer and the payee are the same natural or legal person and both payment accounts are held by the same account servicing payment service provider.
[2] Trusted Beneficiary exemption applies when the payee is included in a list of trusted beneficiaries previously created by the payer.
[3] “Low value” recalls a maximum amount under which SCA may not be applied; this also considers a maximum number of consecutive transactions or a certain fixed maximum value of consecutive transactions.
[4] E-money is a digital form of cash stored electronically(which can also be referred to as digital or electronic wallets)
See also: