Behind the Data – Measuring Flood Risk in Business Lending

Saeed Shahabi Ahangarkolaee, James Carroll, Anna Lalor, Cormac O’Sullivan*
January 2025
This Behind the Data (BTD) describes, for the first time, the share of business bank loans potentially affected by flooding. Flood events affect businesses through direct damage to assets and/or periods of business disruption, with potential implications for profitability, loan repayment, collateral values and access to finance.
Recent climate change projections predict an increase in the frequency and severity of major flooding events across Europe (Adamson, 2018). Over the past six decades, north-western Europe, and particularly the UK and Ireland have experienced significant increases in rainfall and soil moisture, resulting in significantly elevated flood discharges (Boudou et al., 2021). There is also evidence that Ireland will be the second most affected European country in terms of proportion of the national population likely to reside in flood-prone areas by 2100 (Forzieri et al., 2017).
Climate change has economic and financial stability implications (Donnery, 2023). It poses a risk to financial and non-financial corporations directly and indirectly, impacting assets, productivity, and potentially influencing investors and investments (Carroll, 2022 (PDF 1.02MB); Alexander & Fisher, 2019). Increased costs, reduced revenue, and collateral impairment resulting from climate change could diminish the ability of affected non-financial firms to repay loans, thereby elevating credit risk for lenders (Poeschl, 2022).
While the impact of natural disasters on bank operations has been extensively studied, there is a scarcity of research examining banks’ exposure to the risk of natural disasters which may occur due to climate change. Flood risk is particularly pertinent in Ireland and displays significant heterogeneity across the country. From a business perspective, firms located in flood-prone areas may face difficulties in getting a loan, higher borrowing costs, or stricter collateral requirements due to elevated climate-related risk. This could deter investment, impede business growth, and exacerbate regional and sectoral disparities (Meshel et al., 2024). Such challenges have broader implications for economic resilience and development, particularly in flood-affected areas.
This Behind the Data aims to bridge this gap by quantifying the connection between climate risk and bank lending using credit data for Irish firms located in flood-prone areas.
The Data: Connecting Loan Data to Flood Maps
This work merges banking loan-level data for businesses (AnaCredit) to flood maps from the Office of Public Works (OPW). The OPW provides geocoded flood maps for coastal and river areas for a selection of “annual exceedance probabilities” (AEP) – for example, a 1-in-100 year event equates to a 1% AEP. The OPW has evaluated and mapped flood extents, hazards, and risks across various flood events, ranging from frequent minor incidents to infrequent extreme events. AnaCredit is a comprehensive dataset which encompasses detailed information on credit exposures granted by domestic and foreign banks within the euro area to corporations and other legal entities. Covering over 26 million credit instruments monthly, this dataset connects 2,400 banking groups in the euro area with 4.5 million borrowers worldwide. Information includes various attributes such as economic sector, geographical location, size, turnover, and allocated protections. The data used in this analysis reflects balances outstanding as of 30 June 2022.
Flood hazard maps describe the characteristics of predicted floods, encompassing details like flood extent, depth level, and water flow. Flood maps have been created to represent current flood risk, as well as two future scenarios: the Mid-Range Future Scenario (MRFS) and the High-End Future Scenario (HEFS).1 These scenarios consider the potential ramifications of climate change. The MRFS anticipates a 20% elevation in peak rivers flows and 50cm sea level rise, while the HEFS envisions a 30% rise in peak flows and 1m sea level rise.
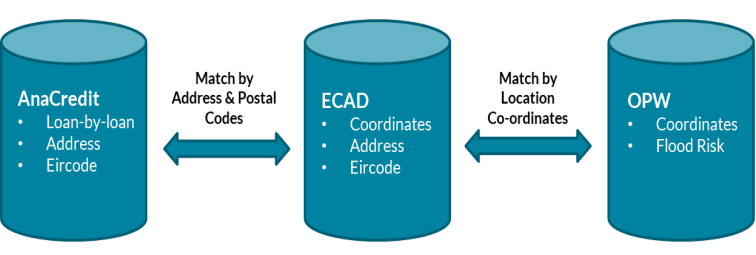
Chart 1: Overview of Datasets Employed and Merging Strategy
Source: own design
Notes: AnaCredit contains all loan and borrower characteristics. ECAD is an Eircode database that includes data on postal code, address and coordinates. OPW contains all flood hazard maps from the Office of Public Works.
Chart 1 provides a high-level description of our datasets and connections to extract precise latitude and longitude coordinates for each borrower. The Eircode dataset “ECAD” contains an up-to-date list of national properties, with information on address, Eircode and coordinates. This dataset is employed as a bridge between AnaCredit and OPW as these datasets will be connected by the coordinate location of businesses. We merge AnaCredit to ECAD using a borrower’s Eircode (when available) or by company name and/or “fuzzy string matching” (FSM) (when Eircode is not available).2 This geolocation information is then employed to extract flood information at business locations from the OPW datasets. The final merged dataset contains loan variables (type and amount of loan), borrower characteristics (sector and size) and flood variables (flood extent by return period and scenario). The validity of this approach rests on the assumption that business address and location of the business activity are the same, which should be true with limited exceptions.3 To our knowledge, this is the first time that a business loan-level data has been combined with geocoded flooding maps in Ireland.
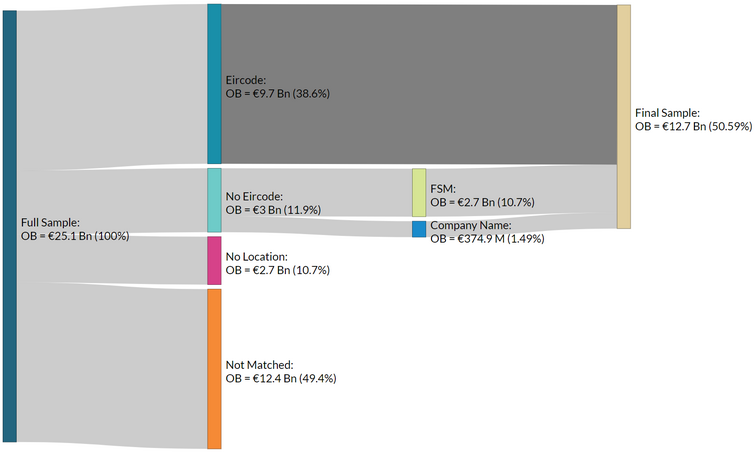
Chart 2: Overview of the Final Dataset
Source: own design
Notes: FSM indicates fuzzy string matching; OB indicates outstanding balance
The matching process reduces the initial sample size by half, but this reduction does not appear to disproportionately affect any particular sub-group of companies. Chart 2 illustrates the overall role of each merging procedure and the loss of data within each. Our initial AnaCredit dataset comprises 201,135 non-financial corporation loans representing €25.1Bn of domestic lending.4 10.7% of loans (by value) do not support any merging procedure due to missing (or low quality) Eircode, address or company name data and are removed from the sample. For loans with Eircodes (38.6% of loan value), direct merging to ECAD is applied. For the remaining loans without Eircodes, 10.7% (of total sample) are successfully matched by address using FSM, and an additional 1.5% are successfully matched by company name. After the full procedure, the remaining sample encompasses 60% of original loan volumes and 51% of original value. While these data losses are relatively large, reductions are broadly consistent across business size categories (micro, small, medium and large), which partly alleviates our concerns that the non-matched data would provide different results to the matched data.
What counties have the loans at most risk?
Businesses are deemed as exposed to floods if they reside in an area with a 1% “annual exceedance probability” (AEP) for river flooding and 0.5% AEP for coastal flooding.5 The analysis also accounts for OPW defences, known as “benefitting areas”. It is important to note that these figures only reflect flood “extent” (property is located in a flooding area) but do not measure potential impact, which is dependent on water depth and type of building. Furthermore, the results describe the share of businesses potentially affected for a given AEP, but the reader should be aware that geographically distinct areas (for example, distant towns) are unlikely to flood simultaneously.
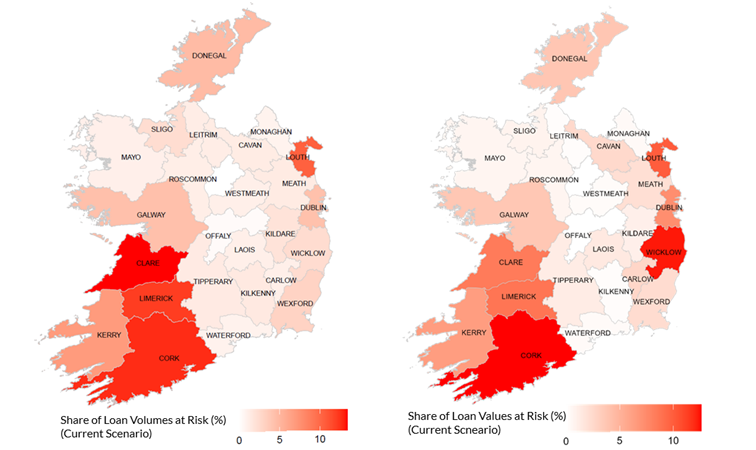
Chart 3: Flood Risk by County – Share of Loan Volumes (left) and Share of Loan Values (right) (Current Scenario)
Source: Own calculations using AnaCredit and OPW data
Notes: Chart considers Irish domestic business lending facilities (including credit card debt, credit lines other than revolving credit, deposits, finance leases, loans, overdrafts, revolving credit, and trade receivables) for the OPW’s Current Scenario for each county. The integrated flood risk map was created by combining three OPW maps: Catchment Flood Risk Assessment Management (CFRAM coastal and river), National Indicative Fluvial Mapping (NIFM), and National Coastal Flood Hazard Mapping (NCFHM). It reflects a 1% probability of occurrence per year for Fluvial/River floods and a 0.5% probability per year for Coastal floods.
Chart 3 (left panel) presents the share of loan volumes potentially exposed (present-day scenario) in each county. Nationally, the share of loans at risk is 5.1%. However, there is considerable heterogeneity across counties and some key areas of higher risk, including Clare (13.4% of loan volumes), Cork (12.7%), Limerick (12.1%), Louth (10.4%) and Kerry (6.9%).
By loan value (Chart 2, right panel), the national share at risk is 6.3%, and again we observe considerable heterogeneity and acute vulnerabilities by county – Cork (13% of loan value), followed by Wicklow (12%), Louth (9.9%), Limerick (8.7%), Clare (8.4%), and Dublin (7.2%).
Share of loans at risk increases sharply under future flood scenarios
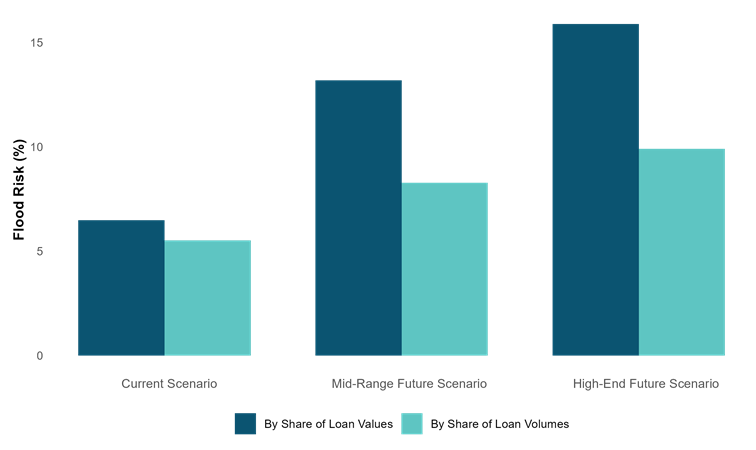
Comparing the OPW’s current, mid-range, and high-end future scenarios allows us to quantify future changes in risk. By share of loans by volume, flood risk increases from 5.1% (today) to 8.3% (mid-range) and 9.9% (high-end).6 However, by share of value, flood risk increases from 6.3% (today) to 13% (mid-range) and 16% (high-end). Such findings highlight the urgent need for continued flood adaptation measures to handle evolving risk over the coming decades.
Chart 4: Flood Risk by Climate Change Scenario
Source: Own calculations using AnaCredit and OPW data
Notes: Chart considers Irish domestic business lending facilities (including credit card debt, credit lines other than revolving credit, deposits, finance leases, loans, overdrafts, revolving credit, and trade receivable) at risk of flooding according to the OPW’s Current, Mid-Range Future, and High-End Future Scenarios. The integrated flood risk map was created by combining three OPW maps: Catchment Flood Risk Assessment Management (CFRAM coastal and fluvial), National Indicative Fluvial Mapping (NIFM), and National Coastal Flood Hazard Mapping (NCFHM). It reflects a 1% probability of occurrence per year for Fluvial/River floods and a 0.5% probability per year for Coastal floods.
Flood Risk by Business Characteristics
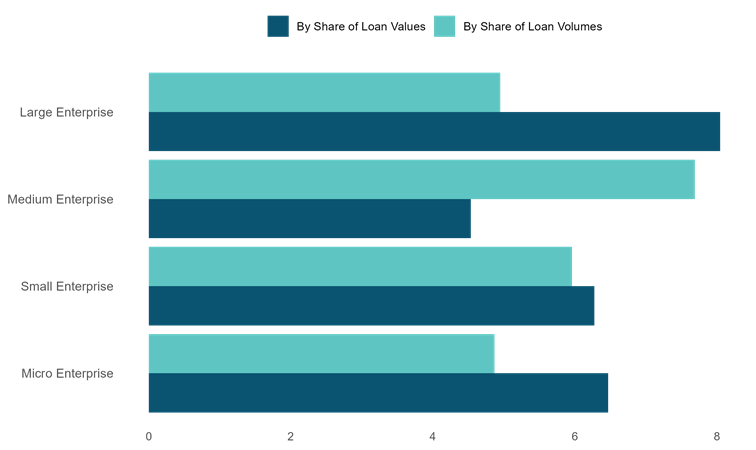
Flood risk among businesses varies significantly on enterprise sizes. Irish business lending is distributed among “large” enterprises (31% of total outstanding balance), followed by “small” enterprises (23%), “micro” enterprises (23%), and “medium” enterprises (22%). Chart 5 reveals differences in flood risk for these categories (current scenario only). Firms in the “micro” category show the lowest share of loans by volume at risk of flooding. However, by share of loan value, “large” enterprises have the highest risk.
Chart 5: Flood Risk by Enterprise Size (Current Scenario)
Source: Own calculations using AnaCredit and OPW data
Notes: : Chart considers Irish domestic business lending facilities (including credit card debt, credit lines other than revolving credit, deposits, finance leases, loans, overdrafts, revolving credit, and trade receivable) for the OPW’s Current Scenario for each county. The integrated flood risk map was created by combining three OPW maps: Catchment Flood Risk Assessment Management (CFRAM), National Indicative Fluvial Mapping (NIFM), and National Coastal Flood Hazard Mapping (NCFHM). It reflects a 1% probability of occurrence per year for Fluvial/River floods and a 0.5% probability per year for Coastal floods.
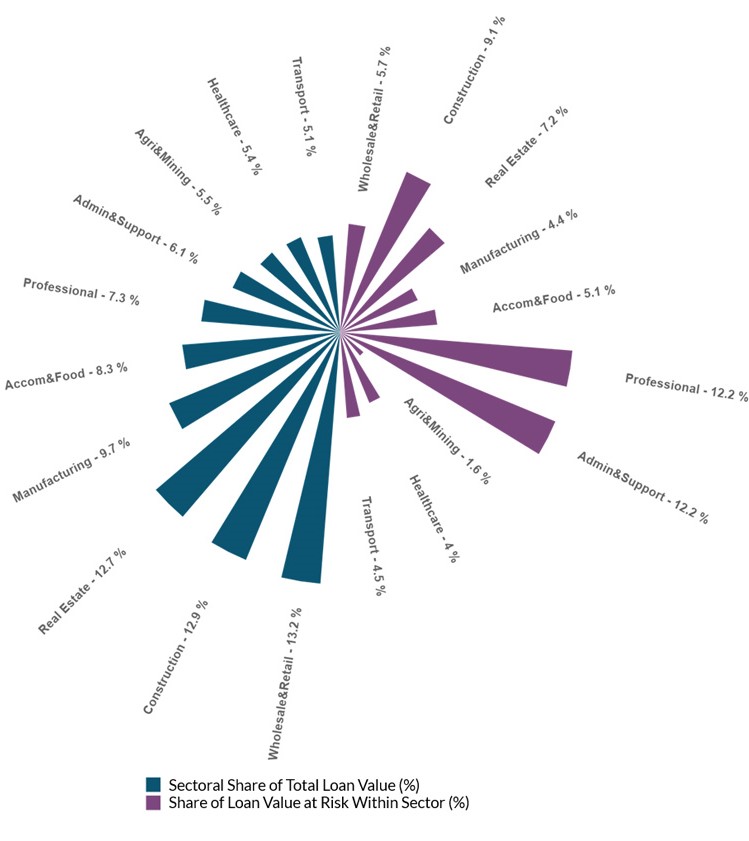
In Chart 6, we explore flood risk across the ten largest economic sectors by loan values (these ten sectors representing 86% of total balances).7 This figure presents bank sectoral exposures (share of total loan value) and risks (loan value at risk of flooding). Almost half (48%) of loan values is to four sectors – Wholesale and Retail (13.2 %), Construction (12.9%), Real Estate (12.7%), and Manufacturing (9.7%). However, the share of such exposures at risk of flood varies considerably – Wholesale and Retail (5.7%), Construction (9.1%) and Real Estate (7.2%), and Manufacturing (4.4%). There are also some notable outliers. For example, Administrative and Support and Professional, Scientific and Accounting sector are considerably above average, each with 12% of loan values at risk.
Chart 6: Flood Risk by Sector (Current Scenario)
Source: Own calculations using AnaCredit and OPW data
Notes: Chart demonstrates Irish domestic outstanding balances at flood risk by sector (‘accommodation and food service’, ‘administrative and support’, ‘agriculture, fishing, and mining’, ‘construction’, ‘manufacturing’, ‘professional, scientific, and accounting’, ‘real estate activities’, ‘Human healthcare activities’, ‘transport and storage’, and ‘wholesale and retail’) according to the OPW’s Current Scenario. The Present Day Scenario, also known as the Current Scenario, is based on historical flood data methodologies without considering potential climate change impacts. The integrated flood risk map was created by combining three OPW maps: Catchment Flood Risk Assessment Management (CFRAM coastal and fluvial), National Indicative Fluvial Mapping (NIFM), and National Coastal Flood Hazard Mapping (NCFHM). It reflects a 1% probability of occurrence per year for Fluvial/River floods and a 0.5% probability per year for Coastal floods.
Conclusion
The analysis of flood risk exposure across Irish domestic business lending highlights significant vulnerabilities that vary by county, enterprise size, and economic sector. Flood risk differs significantly by county, indicating a pressing need for targeted adaptation strategies to support future resilience. Furthermore, there is considerable risk differences by business size, with risks most acute for micro and large enterprises (by loan value). We also observe higher risks in many key lending sectors. Over time, and without considerable adaptation, flood risks will increase – the share of loan values at risk increases from 6.3% (today) to 13% (Mid-Range scenario) and 16% (High-End scenario). Given the link between flood events, business disruption and asset values, it will important for banks and regulators to monitor this potential channel of credit risk. Flood risk could also affect future business credit access and terms, with implications for business growth and medium term viability. These findings also underscore the need for continued flood risk management strategies to enhance business resilience.
*Email [email protected] if you have any comments or questions on this note. Comments from Manya Bhatia, Bianca Terrell Padraig O’Brien, Rory McElligott, Barra McCarthy and Jean Cassidy are gratefully acknowledged. The views expressed in this note are those of the authors and do not necessarily reflect the views of the Central Bank of Ireland or the ESCB.
[1] For coastal flooding there are two additional more severe scenarios but these are not captured in this analysis.
[2] Fuzzy matching merges two datasets based on imperfect unique identifiers. In this study, we employed the “RapidFuzz” package in Python for fuzzy string matching, a technique designed to identify strings that are similar, accommodating minor discrepancies such as typographical errors, variation in spelling, or inconsistencies in data entry. This method is crucial for handling data variations in large datasets where exact matches are not always possible due to data quality.
[3] For example, real estate development and investment companies may not have the same address as the location of construction or investment. Furthermore, a corporate group with a parent company and many subsidiaries in different locations may see a parent that borrows and faces no flood risk, although the subsidiaries may all be exposed to flood risk.
[4] Data are valid as of October 2024. We use the term “loans” throughout for ease of interpretation. However, this category also includes credit card debt, credit lines other than revolving credit, deposits, finance leases, overdrafts, revolving credit, and trade receivables. Furthermore, “value” refers to outstanding/drawn balances.
[5] A 1% AEP for river flooding refers to a flood event that has a 1% chance of occurring in any given year (commonly known as a “1 in 100-year flood”). Similarly, a 0.5% AEP for coastal flooding means there is a 0.5% chance of such flooding occurring each year (a “1 in 200-year flood”). Different AEPs are used for coastal and river due to data availability.
[6] Estimated using the same AEPs as above.
[7] In Chart 6, we abbreviate the names of some economic activities as follows: “Accommodation and food service” to “Accom&Food”, “Administrative and support” to “Admin&Support”, “Agriculture, fishing, and mining” to “Agri&Mining”, “Professional, scientific, and accounting” to “Professional”, “Real estate activities” to “Real Estate”, “Human healthcare activities” to “Healthcare”, “Transport and storage” to “Transport”, and “Wholesale and retail” to “Wholesale&Retail”.
See also: