Inflation, growth and the outlook for the euro area
13 September 2024
Blog

At our meeting yesterday, my Governing Council colleagues and I decided to lower the deposit facility rate – the rate through which we steer the monetary policy stance – by 25 basis points, to 3.5 per cent. We also discussed the new projections from ECB staff, the prospects for the euro area and the Draghi report (on which I hope to Blog at some point in the future).
Inflation
The updated projections show that we remain on track to reach our 2 per cent inflation target in the fourth quarter of 2025 (Chart 1), but there is some uncertainty around this baseline forecast. In particular more persistent services inflation and stronger than expected wage growth could impact the forecast. Both are expected to remain high for the rest of this year and, in the case of wages, exceptionally volatile. (The Wage Tracker developed by the Central Bank of Ireland in collaboration with Indeed has moved within a range of 3.5 – 4 per cent for the euro area since the beginning of the year, with the most recent data for July at 3.8 per cent.)
The latest inflation projections indicate a pick-up in the last quarter of 2024, as services inflation persists and energy, food and goods disinflation gradually fades, before resuming its downward path in early 2025 (Chart 1). Services accounts for the largest share of ‘core inflation’ – 64 per cent in the euro area and 70 per cent in Ireland, the rest is made up of spending on goods – and so can have a large bearing on developments in underlying inflation.
While annual services inflation is currently high – hovering around 4 per cent in both the euro area and Ireland, around double pre-pandemic levels – we are seeing tentative signs of an easing in measures of momentum. A slowing of euro area services inflation during 2025 is, in part, predicated on a slowdown in wage growth (Chart 2), as the gap between the past inflation surge and wages (so-called ‘catch-up dynamics’) gradually closes.
Chart 1 | Euro area headline and core Inflation (% annual change)
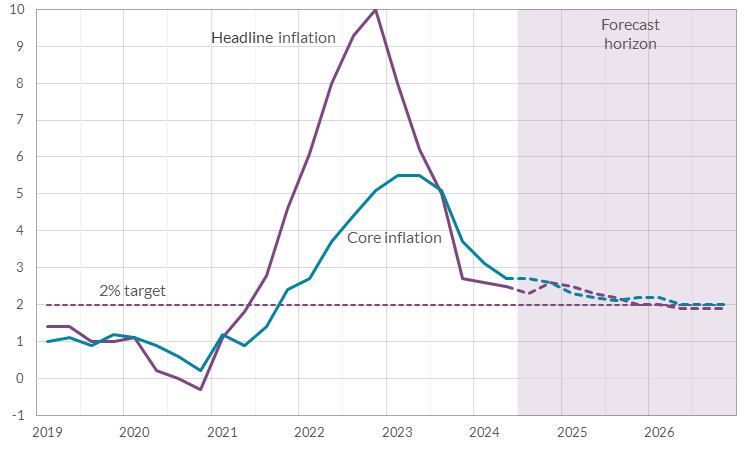 Source: Eurostat and ECB Staff Projections. Core inflation excludes food and energy.
Chart 2 | Euro area wage Growth (% annual change)
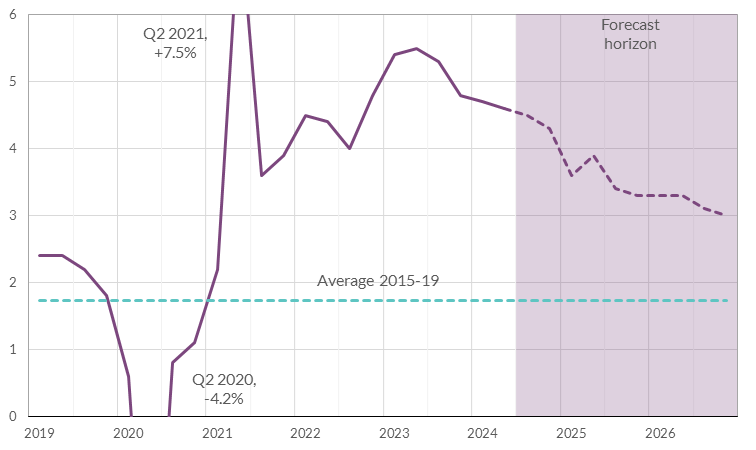 Source: Eurostat and ECB Staff Projections. Annual percentage change in compensation per employee in the euro area.
Euro area economic performance
Growth in the euro area as a whole slowed in the second quarter of 2024, driven by weaker investment and consumption. There are, however, significant growth differences across euro area countries, with stronger performance in the likes of Spain and France, but weaker in Germany. Given the extensive cross-country trade-linkages from integrated manufacturing supply-chains, ongoing challenges for German industry, compounded by competitiveness losses, could drag on euro area growth.
Having said this, the central-scenario in the latest staff projections is for a consumption-led growth recovery (Chart 3), albeit marginally weaker than what was expected in the June projections. Employment growth is projected to be somewhat weaker than its pre-pandemic average (Chart 4). This partially reflects an unwinding of the labour hoarding we saw during the period of weak growth in 2022-23. Consumption is supported by the recovery in real incomes, under-pinned by positive real wage growth.
Chart 3 | Euro area GDP growth (quarter-on-quarter percentage in real GDP)
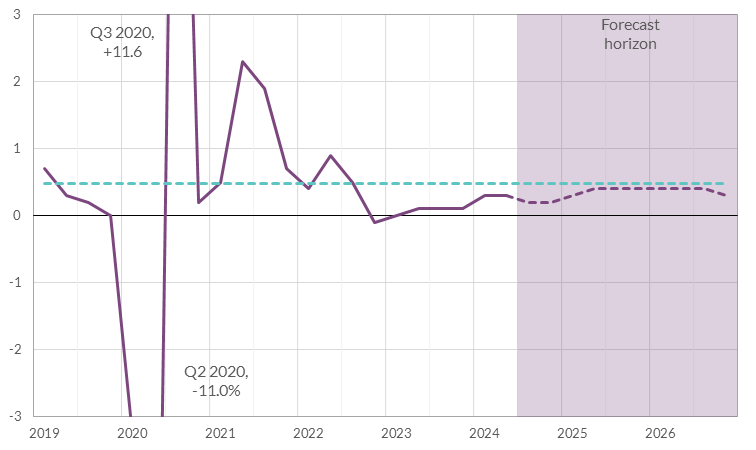 Source: Eurostat and ECB Staff Projections. Quarter-on-quarter percentage change in real GDP in the euro area.
Chart 4 | Euro area employment growth (quarter-on-quarter percentage in employment)
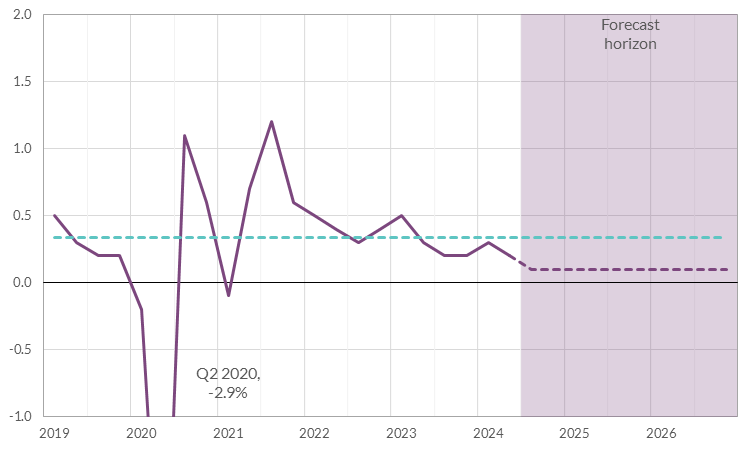 Source: Eurostat and ECB Staff Projections. Quarter-on-quarter percentage change in employment in the euro area.
Reduction in the Main Refinancing Operations (MRO) rate: impact on borrowers with a tracker mortgage
By the way, as was announced in March, some changes to the operational framework for implementing monetary policy will take effect from next week (18 September). In particular, the spread between the interest rate on the main refinancing operations (MRO) and the deposit facility rate (DFR) will be set at 15 basis points. Accordingly, with the DFR decreasing to 3.5 per cent, the MRO will be 3.65 per cent and this means that the MRO rate will decline by 60 basis points in total, or 0.6 per cent. (The changes to the operational framework for implementing monetary policy impact how central bank liquidity is provided to the banking system over the coming years.)
This will have a direct impact on many tracker mortgage holders here in Ireland whose reference rate is predominantly the MRO rate. These borrowers will see a reduction in their mortgage repayments. Of the €100 billion in outstanding Primary Dwelling Home mortgages in June 2024, some €20 billion (one-fifth) were on a tracker rate.
The outlook for Ireland
In line with the inflation picture we see across Europe, inflation continues to ease here in Ireland. The recent CSO flash estimate for August shows inflation at 1.1 per cent, down from a rate of 4.9 per cent this time last year.
While headline inflation has eased substantially, influenced by a decline in externally driven prices, inflationary pressures remain high in some areas. Notably, services inflation is currently above 4 per cent, more than twice the headline rate, and is expected to be the main positive contributor to headline and core inflation in the coming years, echoing what we see in the rest of the euro area.
Following rapid growth in 2023, the latest data indicate that domestic economic activity continues to expand in 2024 and the short-term outlook remains broadly favourable. We will be publishing our Quarterly Bulletin next Wednesday (18 September) which will outline our current economic projections, so I won’t say any more about that now.
However, one thing I want to repeat, as we look forward to next month’s budget is the important role that fiscal policy has to play in supporting monetary policy as it impacts Ireland. As I said in my July blog on “Budget Choices and the Economy” it is important that fiscal policy strikes a balance between sustainably delivering on the necessary rise in public capital investment in the coming years (not least to manage some of the infrastructure challenges that the country faces), and current spending demands that seek to maintain or enhance existing levels of public services.
Conclusion
To sum up, my colleagues and I remain determined to ensure that inflation in the euro area returns to its 2 per cent medium-term target in a timely manner. The latest ECB staff projections suggest this will be achieved towards end-2025. However, we continue to operate in a highly uncertain environment, in relation to the path for services inflation and wages, in relation to the growth outlook, and, not least, in relation to potential future shocks that could emanate from geopolitical fragility. We will therefore continue to be data-dependent in our deliberations on the appropriate monetary policy stance, basing our assessment of the inflation outlook on the incoming economic and financial data, the dynamics of underlying inflation and the strength of monetary policy transmission. We are not pre-committing to a particular rate path.
Gabriel Makhlouf